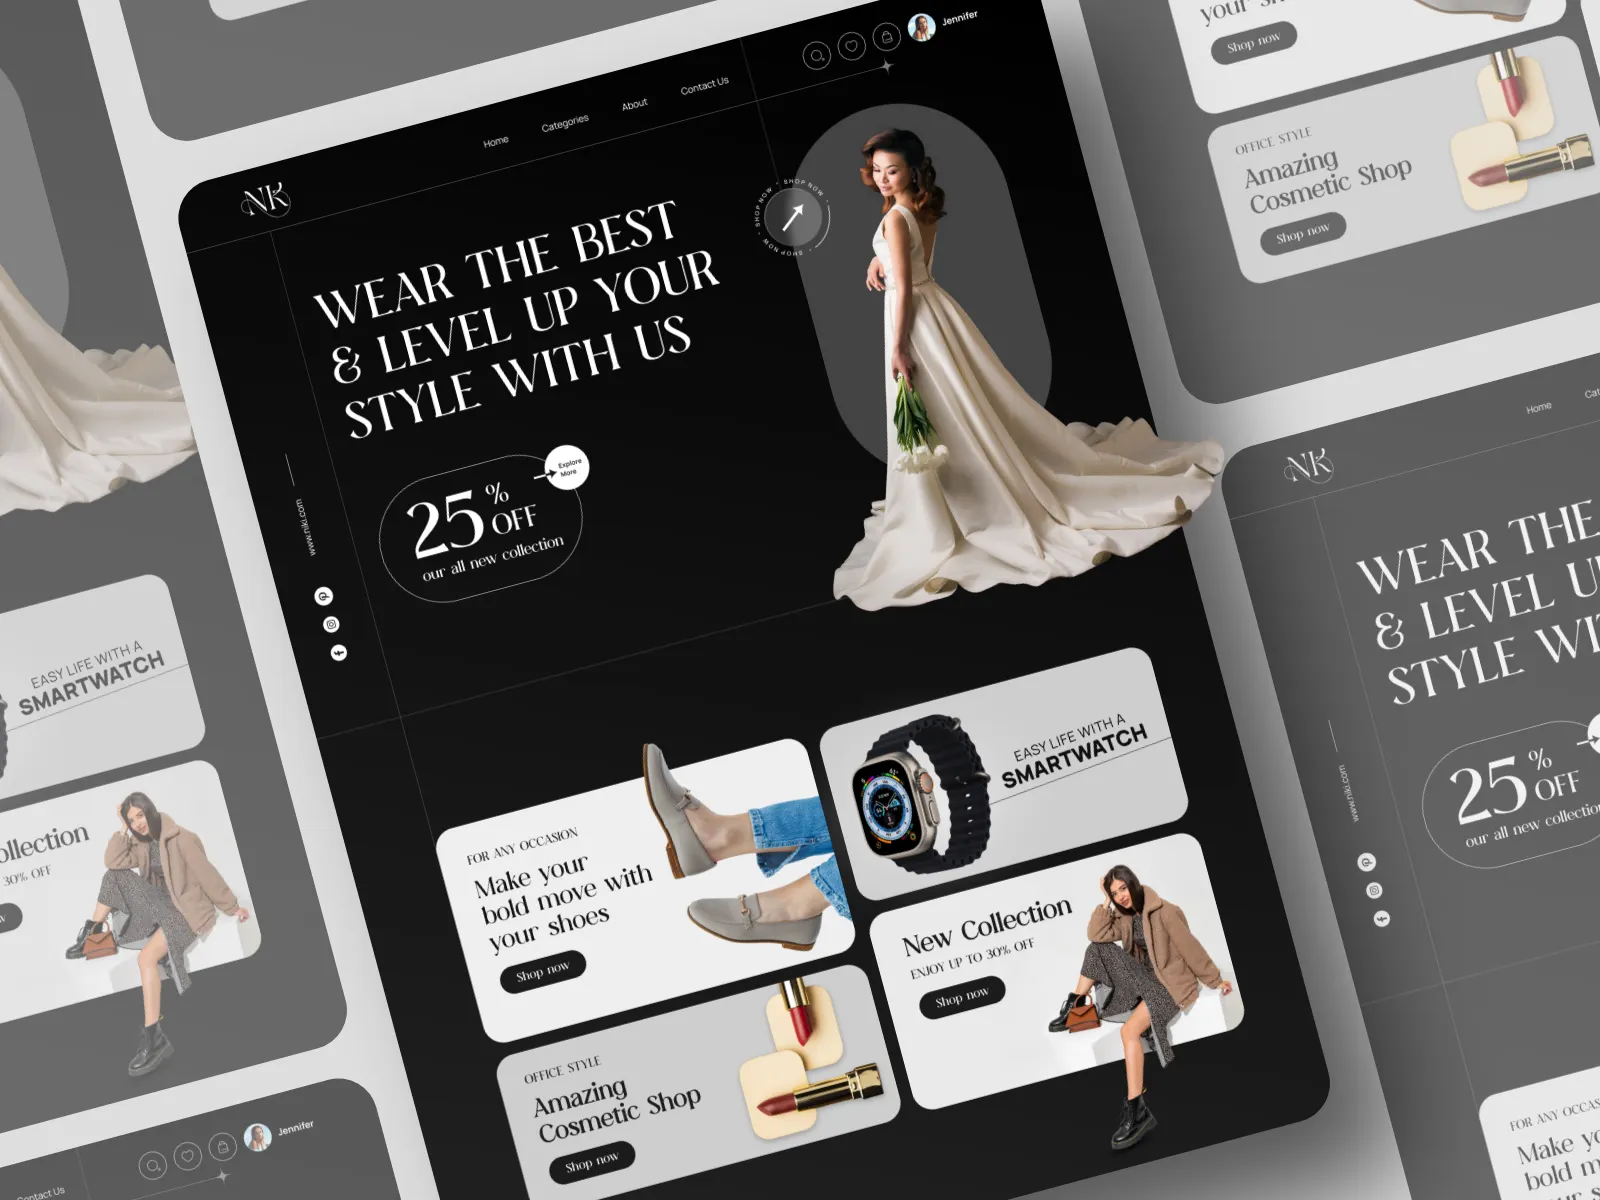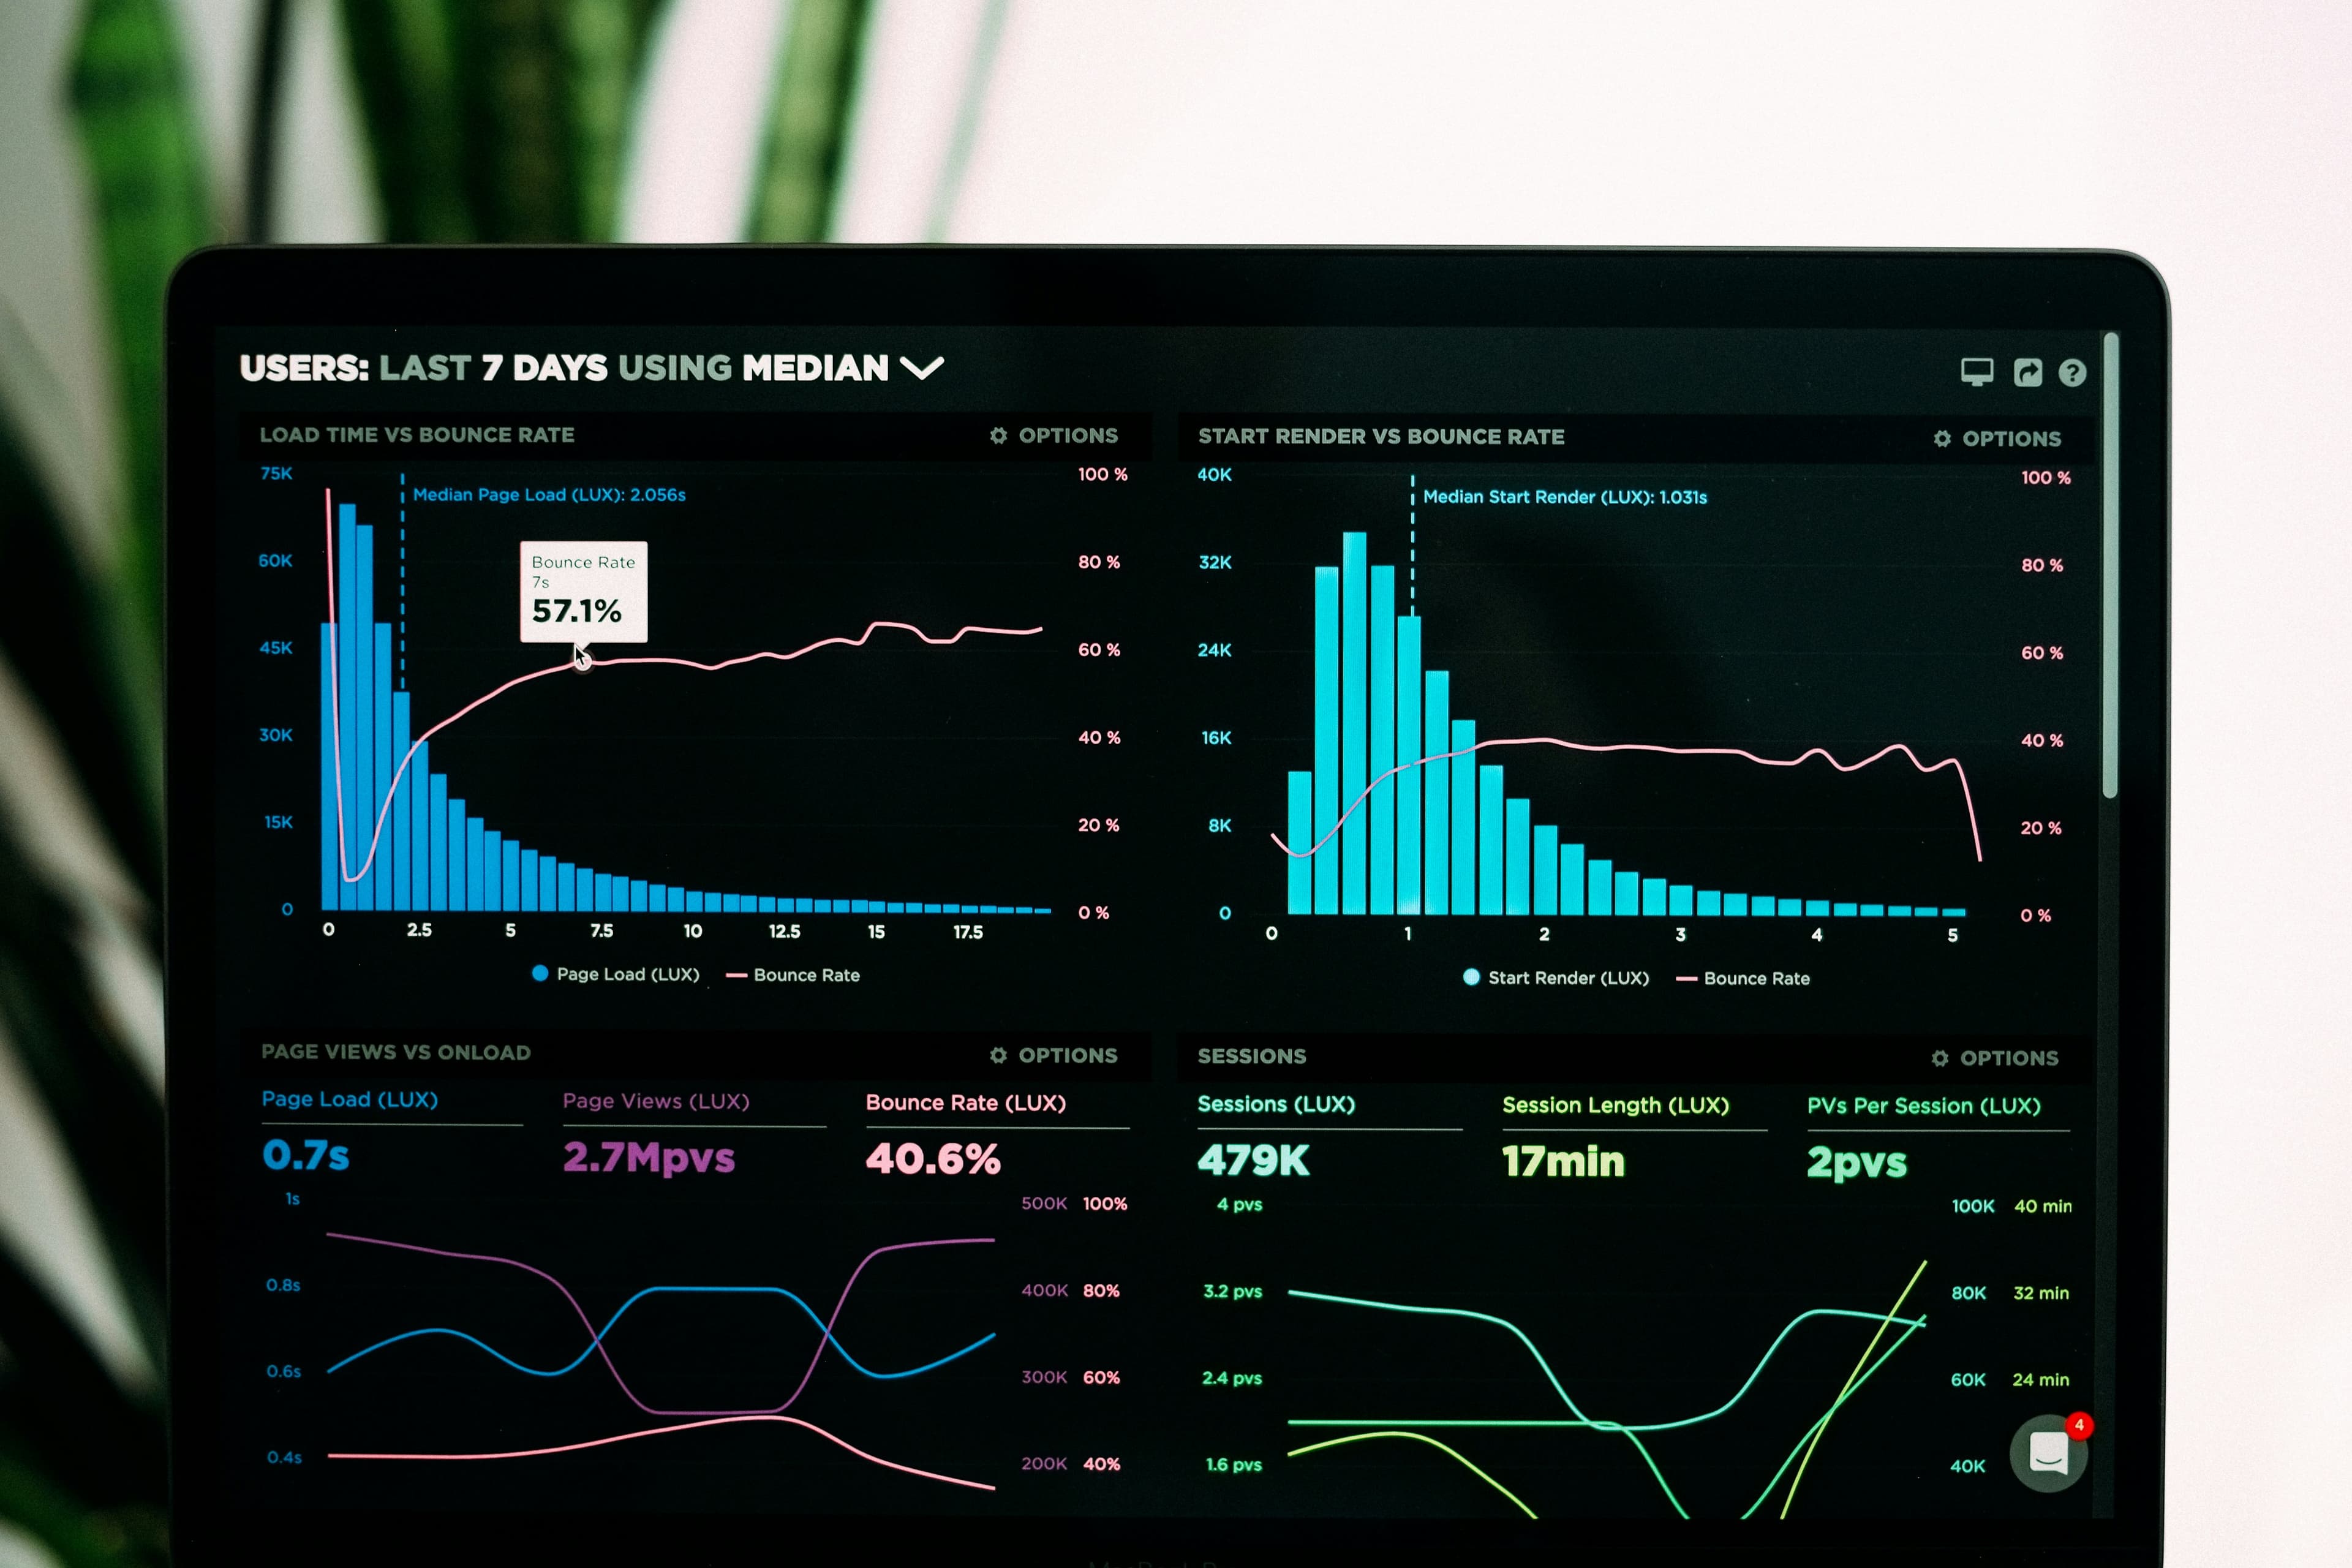
Dashboard UI
SaaS Analytics
Designed the analytics and reporting layer for a B2B SaaS platform serving mid-market e-commerce brands. The dashboard needed to surface revenue intelligence, customer cohort data, and inventory forecasting in a way that non-technical users could act on without opening a spreadsheet.
Tools Used

The Challenge
The engineering team had built a powerful data pipeline with no front-end direction. The result was a raw data dump — tables with 30 columns, charts with no labels, and a date picker that required knowing the exact fiscal quarter format. User testing showed a 0% task completion rate for first-time users.
The Solution
We started with eight days of user interviews, then rebuilt information architecture around three user jobs-to-be-done: understand performance, find problems, and plan ahead. Each section got a dedicated dashboard view with progressive disclosure. We introduced a guided onboarding mode and a natural language query input that reduced support tickets by 60%.